Cloud

Get your cached app logs and metrics with high performance!

Log Cache is a Loggregator feature that lets you filter and query app logs and metrics through a CLI plugin or API endpoints – with a better performance than before. In addition, cached app logs and metrics are available on demand; you do not need to stream them continuously. To understand this, let’s take a look into the history of log streaming within Cloud Foundry.

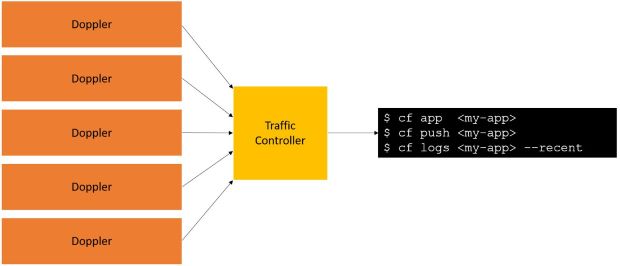
There are several things wrong with how the retrieval of logging and metric data is currently working. Let’s see, how the current architecture looks like.

Each time you execute “cf push”, “cf app” or “cf logs”, there is a request sent to the traffic controller which needs to lookup every single doppler instance and aggregate the logs and metrics you are interested in. Obviously, this architecture leads to performance issues in a growing environment. And this is why we need Log Cache!

Log Cache is a component co-located on the Doppler servers that duplicates and stores the information coming from Loggregator. Unlike the Firehose data stream, which is constantly cleared to make room for new messages, the Log Cache persists data from Loggregator so that it is possible to query them on demand. The Log Cache is accessible either via the CF CLI plugin or via RESTful interface.

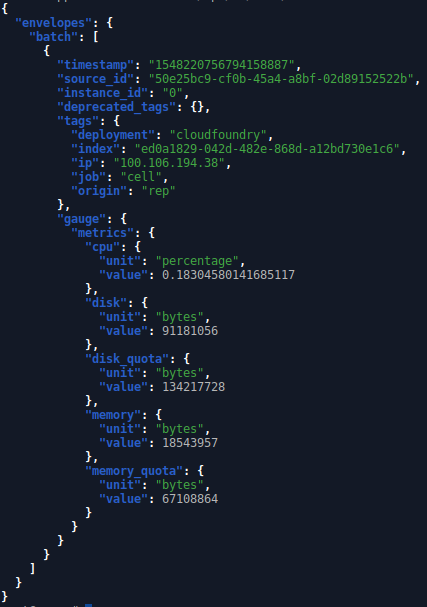
The following metrics are available from Log Cache:

  • cpu (percentage)
  • disk (bytes)
  • disk_quota (bytes)
  • memory (bytes)
  • memory_quota (bytes)

Query the Log Cache using the cf-CLI

Once you’ve installed the Log Cache plugin as described here https://github.com/cloudfoundry/log-cache-cli(opens in new tab) you can use the following CF CLI command to access your logs and metrics: 

$ cf tail

“my-app” can either be the app-guid or the app-name

This query would return a series of timestamped metrics like the following:

By default, cf tail returns the 10 most recent messages. Each message includes the following:

  • A timestamp
  • The source application or component
  • The event or envelope type
  • The message contents

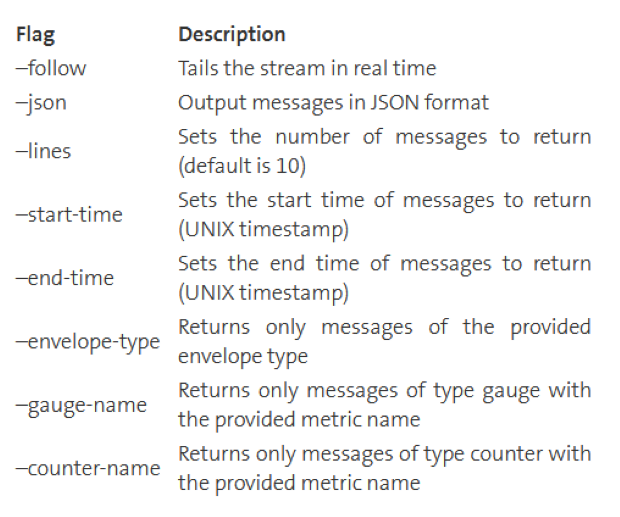
There are several flags that you can include with cf tail to focus your queries:

Query the Log Cache using the RESTful interface

To query the Log Cache programmatically, you can make API calls to its RESTful endpoint:

https://log-cache./api/v1/read/

You will need to provide a UAA authorization token, you can get this via cf CLI executing the command “cf oauth-token” or via API:

curl -v -XPOST -H "Application/json" -u "cf:" -data "username=&password=&client_id=cf&grant_type=password&response_type=token" https://login.lyra-836.appcloud.swisscom.com/oauth/token

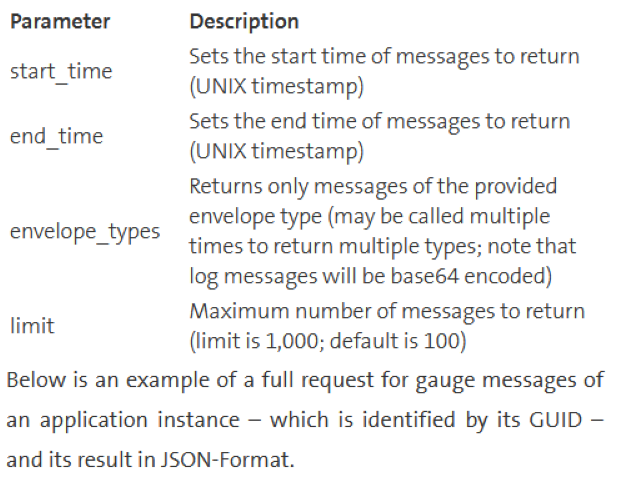
Within the API you also have the option to include parameters:

curl -s -H “Authorization: Bearer xxxxx” ‘https://log-cache.lyra-836.appcloud.swisscom.com/api/v1/read/?envelope_types=GAUGE&limit=1’ | jq.

Be smart and switch to Log Cache for getting your app metrics and logs!

Andrea Aymon

Andrea Aymon

Cloud Engineer

More getIT-articles

Ready  for  Swisscom

Find the job or career to suit you. A career where you can make a difference and continue your personal development.

What you do is who we are.

Go to careers

Go to current cyber security vacancies