App Cloud

Building ELK Stack with Elasticsearch

We have launched our brand new Elasticsearch service on the Swisscom Application Cloud (in closed beta at the time of writing, but general availability will occur shortly). This service replaces our old ELK offering with more stable and flexible options. In this post we show you how to use Elasticsearch in conjunction with the Logstash and Kibana buildpacks to obtain the ELK stack which you already know. Furthermore, we will give you some starting points on using the increased flexibility of the offering to tailor the stack to your needs.

Creating the service instance

We are going to start by creating an instance of the new Elasticsearch service. If you check our marketplace using cf marketplace, you will see that there are six different plans to choose from ranging from xxsmall* to xlarge*. These t-shirt sizes are indicative of the amount of RAM which your Elasticsearch instance will receive and as a function of that the amount of disk space. For the purposes of our tutorial xxsmall* is sufficient. For your productive ELK stack, you might of course need a bigger plan. So let’s create the instance:

This provisions a three-node Elasticsearch cluster which is stretched over three locations. Next, we will add Logstash and Kibana. Our old ELK offering included Logstash and Kibana with hardwired configurations as part of the service instance. In the new approach this is no longer the case. Instead we install both of these components ourselves using the Logstash (opens in new tab)and Kibana (opens in new tab)buildpacks. These buildpacks are used to push both components as apps in Cloud Foundry, picking up the respective configuration provided by the user in various configuration files. This is a little more hassle to set up but comes with the clear benefit of enabling customized configurations in a very natural way.

Installing Logstash

Please note: this section is currently being changed in order to describe the new way of deploying Logstash(opens in new tab).

So let’s set up the minimal configuration we need to push Logstash using the Logstash buildpack(opens in new tab). We start in a new directory

and we create the following two files

As usual in Cloud Foundry, we write a manifest.yml to tell the platform how to set up Logstash as an app. We will call the app my-logstash and it will of course bind to our Elasticsearch instance. We also use the buildpack option to tell Cloud Foundry to use the Logstash-Buildpack(opens in new tab).

The Logstash file which we also created contains configuration settings for Logstash. If you leave this file empty, Logstash will run using default settings. In our case we want to add authentication in order to protect our Logstash instance from unauthorized access, so we add the following lines to Logstash

With that step our Logstash instance is ready for deployment, so we push it.

Once the push completes, we have a running Logstash connected to our Elasticsearch instance. Now let’s do the same thing for Kibana.

Installing Kibana

Please note: this section is currently being changed in order to describe the new way of deploying Kibana(opens in new tab).

So let’s again start in a new directory for preparing our deployment of Kibana.

We add the following two files to this directory to provide the minimal configuration

In the Kibana config file we include the X-Pack plugin. This plugin provides support for authenticated access which we will require to protect our Kibana UI. The plugin also features a whole range of other add-on functionality for Kibana and Logstash which are beyond the scope of this post.

In manifest.yml we define that our Kibana instance will be called my-kibana, will connect to our Elasticearch instance and will receive 3G of memory needed to install the X-Pack plugin. In principle you can scale down you Kibana instance to 2G after the initial deployment, as the extra memory is not needed after the installation. We again use the buildpack option to tell Cloud Foundry to use the Kibana buildpack(opens in new tab).

We can now go ahead with pushing Kibana.

When the push completes we are done with setting up all of the necessary components. We can verify the setup by typing

When the push completes we are done with setting up all of the necessary components. We can verify the setup by typing

Connecting the stack to your app

Next, we want to start forwarding application logs to our newly built ELK stack. For this we create a user provided service using the -l option. This option enables apps which bind to the service to stream their logs to a syslog-compatible component, in our case Logstash.

As a last step we now bind this user provided service to the app which we want collect logs from and restage the app.

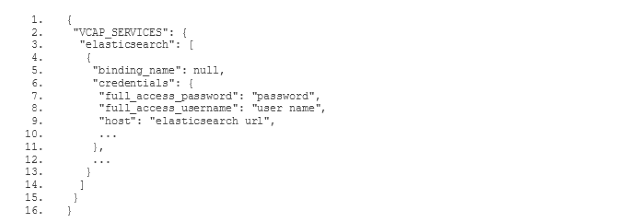
We are now done with the basic setup of our ELK components. Before we go on to perform further configuration, let’s make a first quick test by logging into Kibana. The url of the Kibana instance in this example is my-kibana.scapp.io. The login credentials we obtain from the VCAP_SERVICES environment variable of our Kibana app

and look for the fields full_access_username and
full_access_password

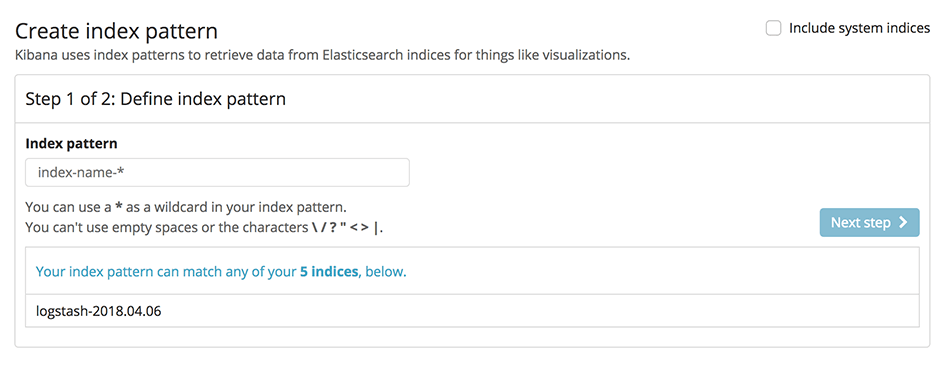
After logging in we are prompted to create a first index pattern. At the moment we only have a logstash index to choose from (make sure you have triggered some log traffic from your app to see this).

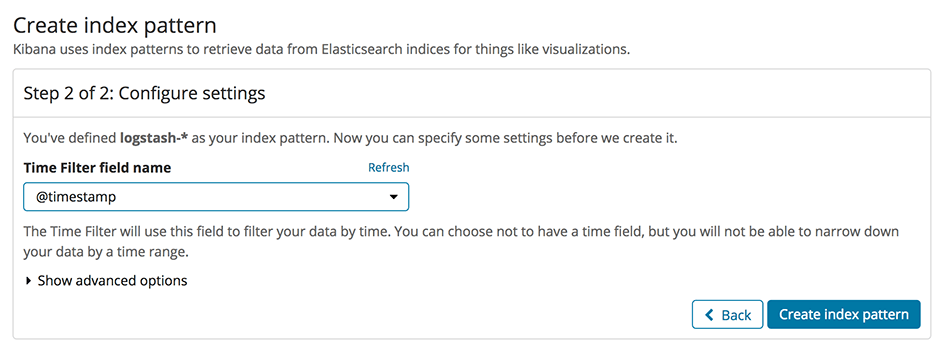
We can specify a pattern to tell Kibana which index or indices to consult when displaying data. If you enter *, all indices will be used. If you type logstash-*, indices with names starting with logstash- will be used. Whenever we specify an index pattern, we can also tell Kibana which field in the data should be used for sorting records over time. We can always choose @timestamp which is a field automatically added by Elasticsearch. Alternatively, we could choose some more suitable field which we are adding to our data as part of our Logstash configuration. Let’s choose @timestamp for this example.

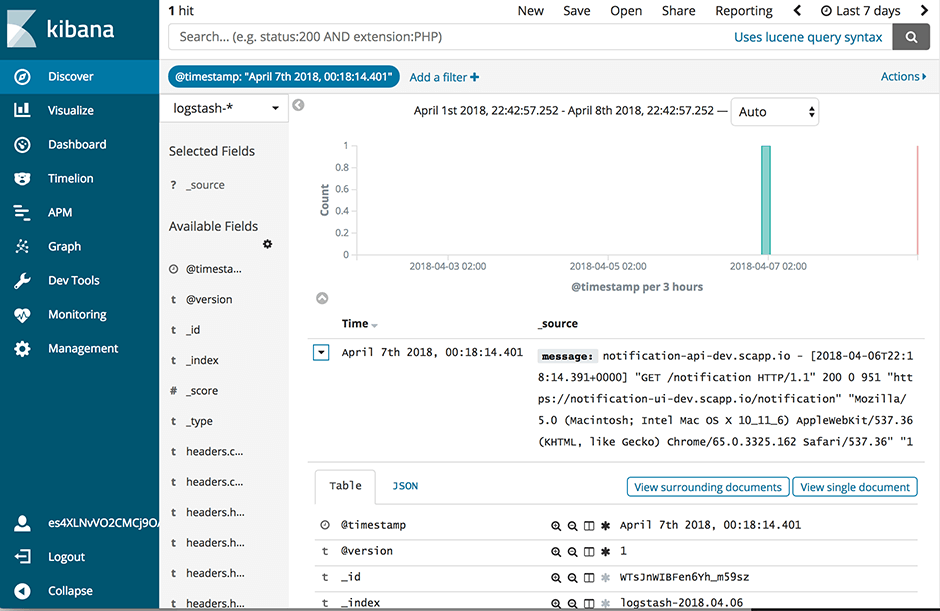
We can now navigate to the Discover screen of Kibana and verify that we are seeing log entries from the app we have bound.

However, when looking at the log entries, we see that they are not yet as structured as we used to have them in the old ELK service. The message field basically contains the whole unanalyzed message. Next, we will see which parts of the configuration we need to customize to obtain the same processing of log messages as the old ELK was performing.

Configuration options

The old ELK service featured a filter which parsed log messages and

- extracted fields according to the Syslog protocol specification(opens in new tab)
- extracted messages containing JSON objects into fields according to the JSON attribute names

Furthermore, it featured a Curator (opens in new tab)configuration which ensured some periodical housekeeping in Elasticsearch. We will describe the details of configuring Curator in a future post, so please stay tuned for that.

Before we get started with the filter configuration, please note that you can find the templates for the config files presented below(opens in new tab) on Github. They are templates because you will have to replace certain parameters, like the Elasticsearch host name of your instance and the access credentials with the corresponding values from your own environment.

In order to configure our new ELK stack to process logs in the same way as the old ELK, we need to go for the mixed configuration mode described in the documentation of the Logstash buildpack(opens in new tab). In particular we need to specify our own filter and output configuration. For this purpose we add a two new subdirectories conf.d and grok-patterns to the directory where we have set up our Logstash configuration. Furthermore, we add the files filter.conf, output.conf and grok-patterns in these directories as follows:

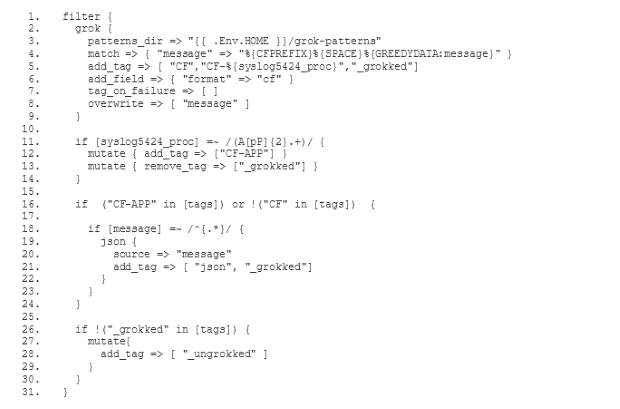
In filter.conf we specify a custom filter definition which performs the Syslog and JSON parsing. So, this file needs to contain the following lines:

This filter definition references a grok pattern which we needs to be present in the file grokpatterns:

The above grok pattern separates the standard prefix of a Cloud Foundry log line into the appropriate fields of the Syslog specification.

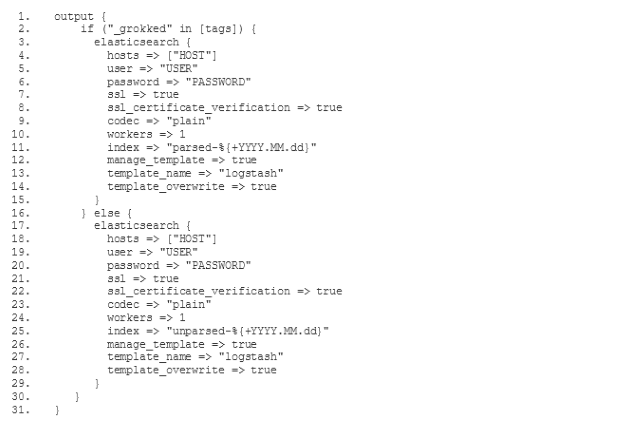
As with the old ELK we want to split up the indexing into two separate indices, one for parsed messages and one for messages which were not parsed by the above filter. To achieve this, the file output.conf contains the following lines:

The HOST, USER and PASSWORD values need to be the host, full_access_username and full_access_password from the elasticsearch entry in VCAP_SERVICES of my-logstash.

As a last step, since we are in mixed configuration mode of the Logstash buildpack and we are specifying our own filter and output definitions, we need to reference the default input definition explicitly in the file Logstash:

We need to push Logstash again in order for these changes to take effect.

If we trigger some log traffic and then go back to Kibana, we can see that there are two new indices in Elasticsearch when we go to Management > Index Patterns > Create Index Pattern. The name of the first one starts with parsed-. This is the index which receives all of the messages parsed by the filter which we just wrote. The name of the second new index starts with unparsed-. It contains any messages which could not be parsed by the filter. Thus, with a few configuration steps we have arrived at the behaviour of the old ELK service. What if you want to migrate some indices from an old ELK instance to the new Elasticsearch? Let’s have a look at how to achieve that.

Migration from the old ELK service

We will use the elasticdump (opens in new tab)utility for migrating indices from an old ELK to a new Elasticsearch instance. To install elasticdump we run

Next, we have to set up ssh tunnels to our old ELK and to our new Elasticsearch. We need to make sure that both services are bound to at least one app in the space we are working in, so that the relevant security groups are created in Cloud Foundry and access to both services is granted from that space. If you get connection refused while connecting the first time, try to restart your app so that latest security group settings are propagated. Now we have to collect a number of parameters for establishing the tunnels. Let’s start with the old ELK instance. We inspect the environment of an app to which this instance is bound:

In VCAP_SERVICES we will find the host, port and credentials for ELK

Let’s continue with the new Elasticsearch instance. We again inspect the environment of an app to which this instance is bound

and we note the host and credentials from VCAP_SERVICES.

Now we can go ahead an set up the tunnel using any one of the apps in the space (it does not matter which one).

Since Elasticsearch checks the hostname on ingoing HTTP requests and matches it to cluster names, we need to set up a local name resolution in /etc/hosts, having both the ELK and the Elasticsearch host resolve to localhost. Thus, we add the following two lines to /etc/hosts

Once the tunnel and the name resolution is established we can check which indices are present in the ELK instance using a simple HTTP request..

We will see an output of the following form listing all indices

Using elasticdump we can now migrate indices one by one to our new Elasticsearch or write a script which migrates them all. For indices created in the past this can be done during normal operation. Therefore, you can gradually import old indices from ELK while your new Elasticsearch is already up and receiving new log data. So, say you want to import the index parsed-2018.04.09 from ELK to Elasticearch. To achieve this, you would run the following two commands

If you now log in to the Kibana instance to which the new Elasticsearch is bound, you will see parsed-2018.04.09 as one of your indices.

Conclusion

So, there you have it! In this post we have shown you how to set up the ELK stack on the basis of the new Elasticsearch offering including the Logstash and Kibana buildpacks. Furthermore, we have demonstrated how to adapt the configuration of the new Logstash buildpack to simulate the settings of the old ELK service. Last but not least, we showed you how to migrate indices from an old ELK to a new Elasticsearch instance. By the way, this new way of setting up the ELK stack also allows you to share one ELK instance across multiple Orgs and Spaces. This will allow you to aggregate logs from various projects and various development stages (and also help you save money). We hope you enjoy our new Elasticsearch offering. Be sure to let us know what you think of it!

Mathis Kretz

Mathis Kretz

Senior Data and Analytics Consultant

More getIT-articles

Ready  for  Swisscom

Find the job or career to suit you. A career where you can make a difference and continue your personal development.

What you do is who we are.

Go to careers

Go to current cyber security vacancies